Viewing Your RunKeeper Data in CartoDB
Viewing Your RunKeeper Data in CartoDB
 RunKeeper is a great app for recording runs and other workout adventures. While its fun to see your workout on the app, it can also be exported and viewed and analyzed. CartoDB is a great mapping platform for visualizing your data. In this exercise, I’ll show the following steps:
- Export your RunKeeper data GPX files.
- Merge all RunKeeper GPX files to a single Shapefile using GDAL/OGR with OSGEO4W.
- Zip shapefile and upload to CartoDB.
- Select time range (with SQL), style and map your favorite run.
- Display the data in IPython.
1. Export your RunKeeper data GPX files
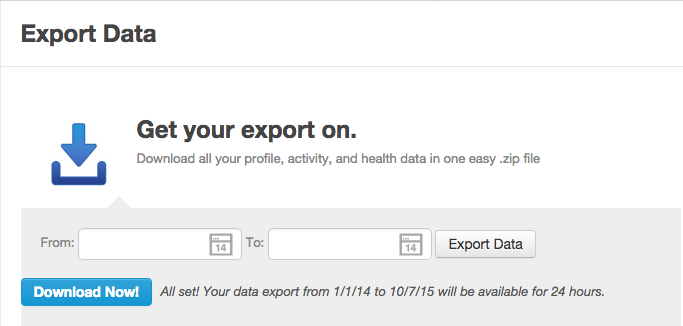
First off, go out and do some runs with the RunKeeper app. After some runs, export your RunKeeper Data with this link.. Here is a webpage with more information on how-to export your RunKeeper Data.
Unzip the file and note its directory location.
2. Merge all RunKeeper GPX files to a single Shapefile using GDAL/OGR with OSGEO4W.
Important Note: you can skip this step if you don’t have GDAL installed or if you just want to view a single run. Skip this step if that’s the case and move to step 3. Zip shapefile and upload to CartoDB.
Any GDAL installation can merge all your files in the folder, for this example I used OSGEO4Windows as I already had a Windows VM up. You can easily run this on Mac as well. Here is a great resource for this operation from this StackExchange post.
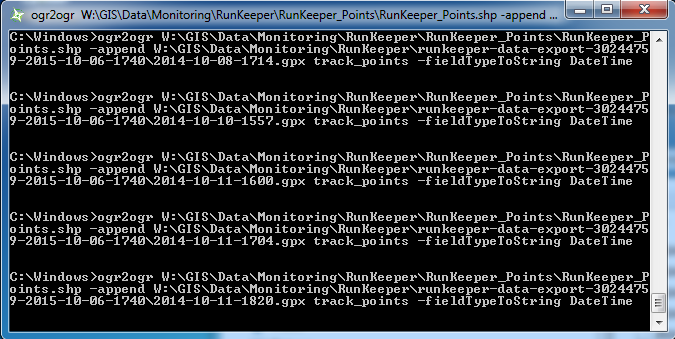
for %p in (W:\GIS\Data\Monitoring\RunKeeper\runkeeper-data-export-30244759-2015-10-06-1740\*.gpx) do ogr2ogr W:\GIS\Data\Monitoring\RunKeeper\RunKeeper_Points\RunKeeper_Points.shp -append %p track_points -fieldTypeToString DateTime
Running the GDAL/OGR in OSGEO4W:
3. Zip shapefile and upload to CartoDB.
Below we are going to zip our shapefile directory up for uploading to CartoDB.
import shutil

shutil.make_archive("/Volumes/Kilo/Dropbox/GIS/Data/Monitoring/RunKeeper/RunKeeper_Points", "zip", "/Volumes/Kilo/Dropbox/GIS/Data/Monitoring/RunKeeper/RunKeeper_Points")
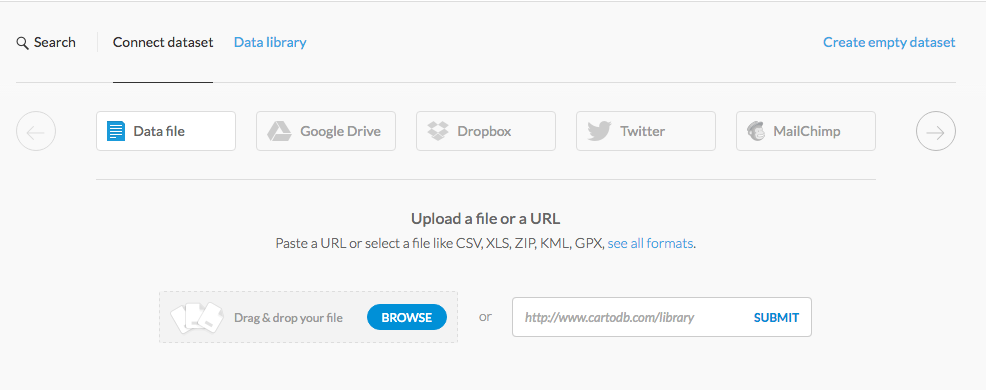
Next, upload your data to CartoDB. You can simply drag-and-drop the zipped file onto your browser.
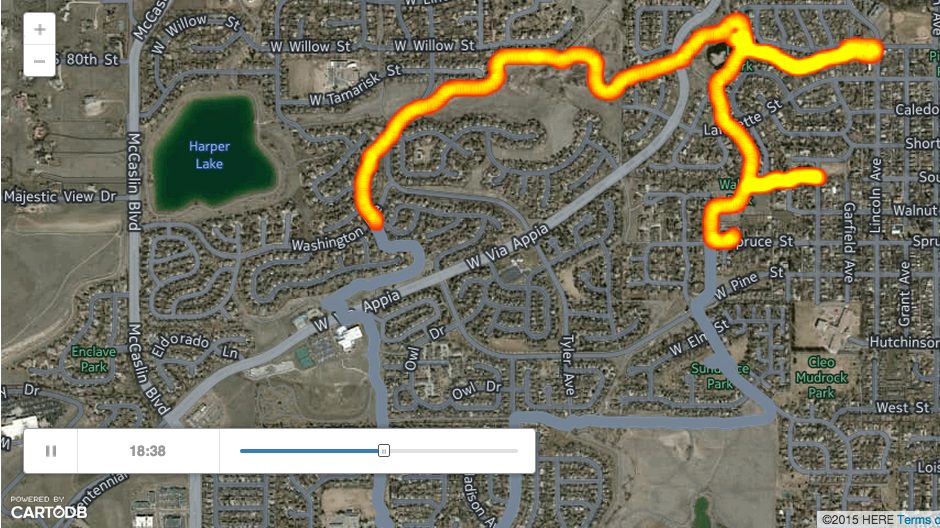
4. Select time range (with SQL), style and map your favorite run.
For this example, I’ll select 1 run from 1 day this summer. June 29th, 2015 I did a fun run near Bolder, CO. The town of Louisville, CO has some great trails between development for running, biking and walking.
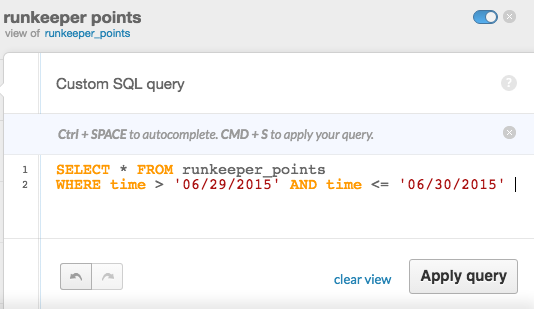 Here’s the code if you’d like to copy and paste (remember to modify the dates to match the date of your favorite run).
SELECT * FROM runkeeper_points
WHERE time > '06/29/2015' AND time <= '06/30/2015'
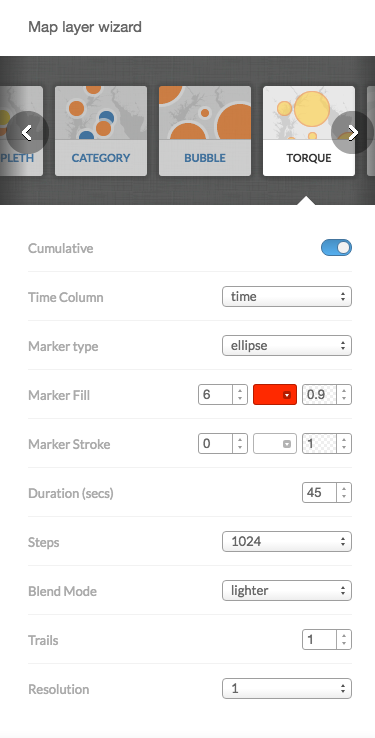
Style the map with Torque
5. Display the data in IPython.
Next I’ll embed an iframe of the embeddable map into IPython (Hit Publish and grab the embed code). More CartoDB/IPython integration may be found here: https://plot.ly/ipython-notebooks/cartodb/.
from IPython.display import HTML
HTML('<iframe width="100%" height="520" frameborder="0" src="https://dms2203.cartodb.com/viz/447b9adc-6c57-11e5-9129-0e31c9be1b51/embed_map" allowfullscreen webkitallowfullscreen mozallowfullscreen oallowfullscreen msallowfullscreen></iframe>')
Next Steps and future things for consideration:
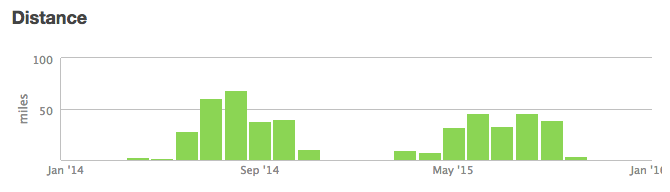
Time between GPS observations
I’m not always running. Yes, I should be running more, but no matter if your an Ultramarathon runner or a casual stroller, you’ll most likely always spend more time not running than running. In fact, the distribution of my runs in the winter is pretty bad as seen below.
For animating my runs, perhaps using the cartodb_id rather than time (datetime) would be beneficial for showing consecutive runs rather than the units of time in Torque passing uniformly.
Here’s an example of that for a few days of running in Brooklyn, NY.
from IPython.display import HTML
HTML('<iframe width="100%" height="520" frameborder="0" src="https://dms2203.cartodb.com/viz/06395e7a-6c62-11e5-a57f-0e674067d321/embed_map" allowfullscreen webkitallowfullscreen mozallowfullscreen oallowfullscreen msallowfullscreen></iframe>')
The SQL to select the days:
SELECT * FROM runkeeper_points
WHERE time > '07/07/2014' AND time <= '07/10/2014'
Zoom to events
Another feature that would be fun to work with is zooming to runs by day, perhaps set the bounding box of the map frame to the envelope of the GPS per day and then zoom to that box for every new day.